Trend charts on the site map
Every channel on the site map has a trend chart. You can look back 24 hours, 7 days or 30 days.
The pictures in this guide use a sample dam project with sample data. Your own site image, nodes and readings will look different.
Fig 1: Opening a trend chart from the site map.
STEP 1 Open a card
Hover over a node or a sensor on the site map. Its card opens.
STEP 2 Click the chart icon
Click the chart icon next to the reading you want.
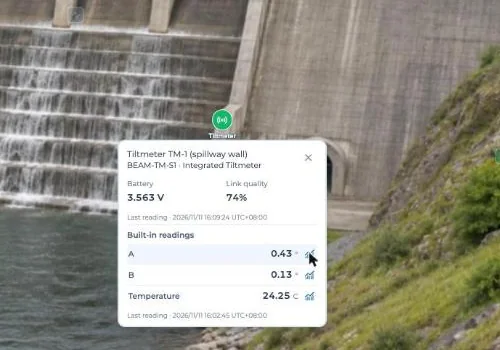
Fig 2: The chart icon next to each reading.
The chart opens at the bottom of the page. It shows the node, sensor and channel.
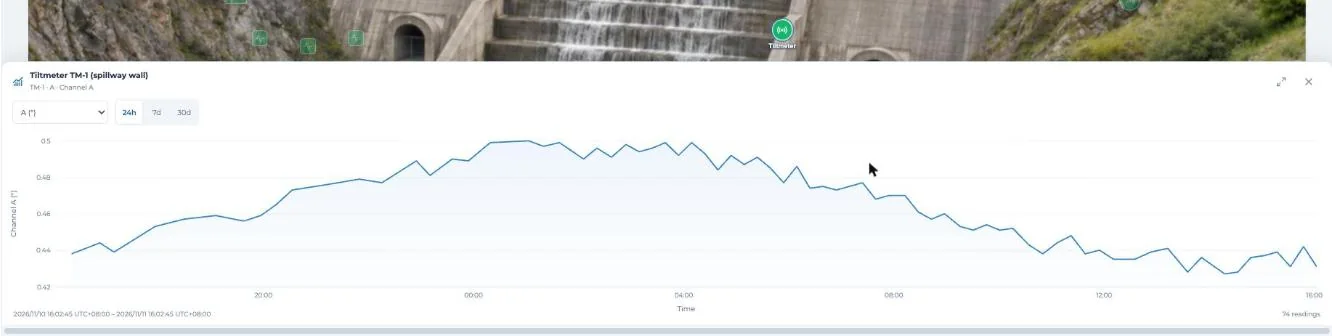
Fig 3: A tiltmeter channel over 24 hours.
Tip: On GeoArray and ShapeArray cards, the chart icon is at the top of the card.
STEP 3 Pick a time range
Click 24h, 7d or 30d.
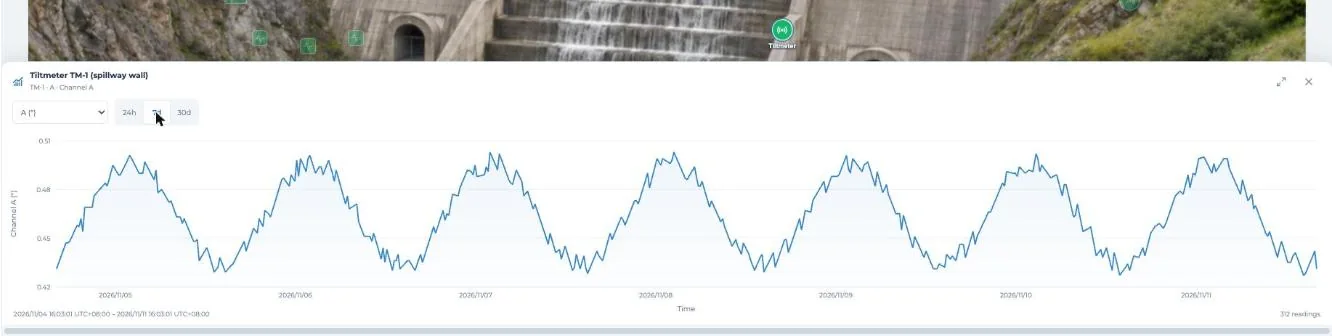
Fig 4: 7 days.
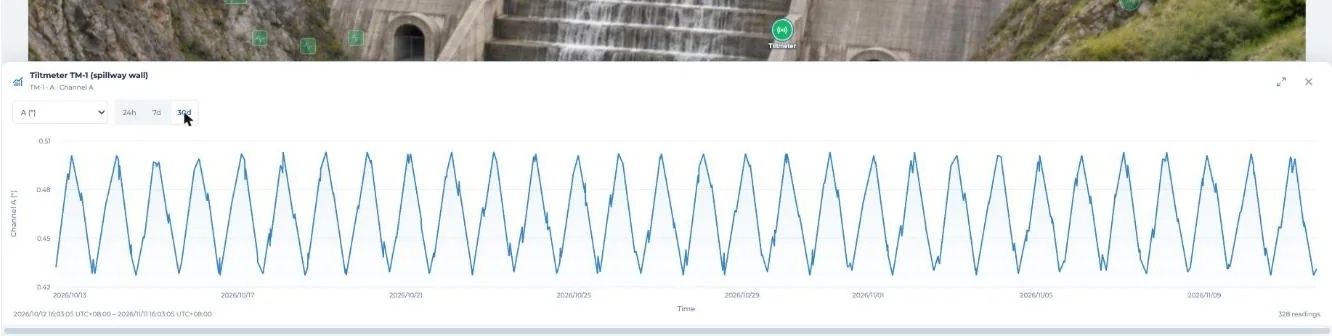
Fig 5: 30 days.
Under the chart you will see the date range and the number of readings shown.
STEP 4 Read exact values
Hover over the line. You will see the time and value of that reading.
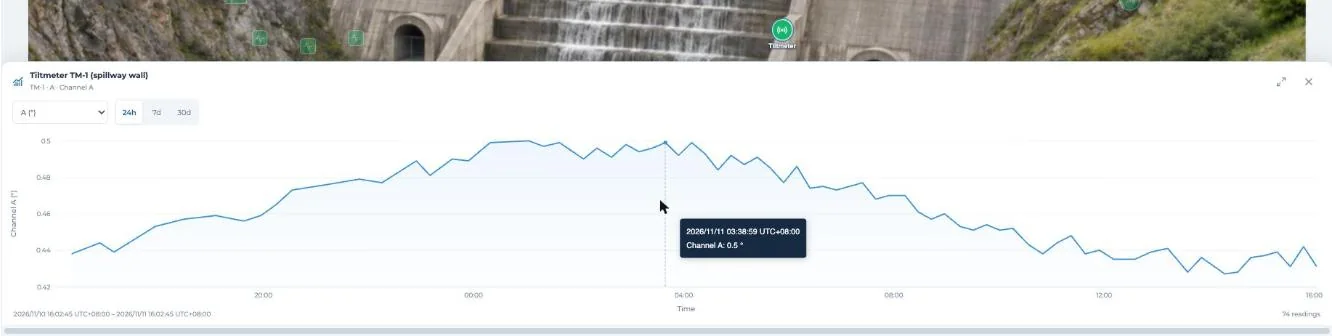
Fig 6: Time and value of one reading.
STEP 5 Switch channel
Use the drop-down at the top left of the chart. It lists every channel, with its unit.
STEP 6 Make it bigger
Click the expand icon at the top right. Click it again to shrink the chart.
Click × to close the chart.
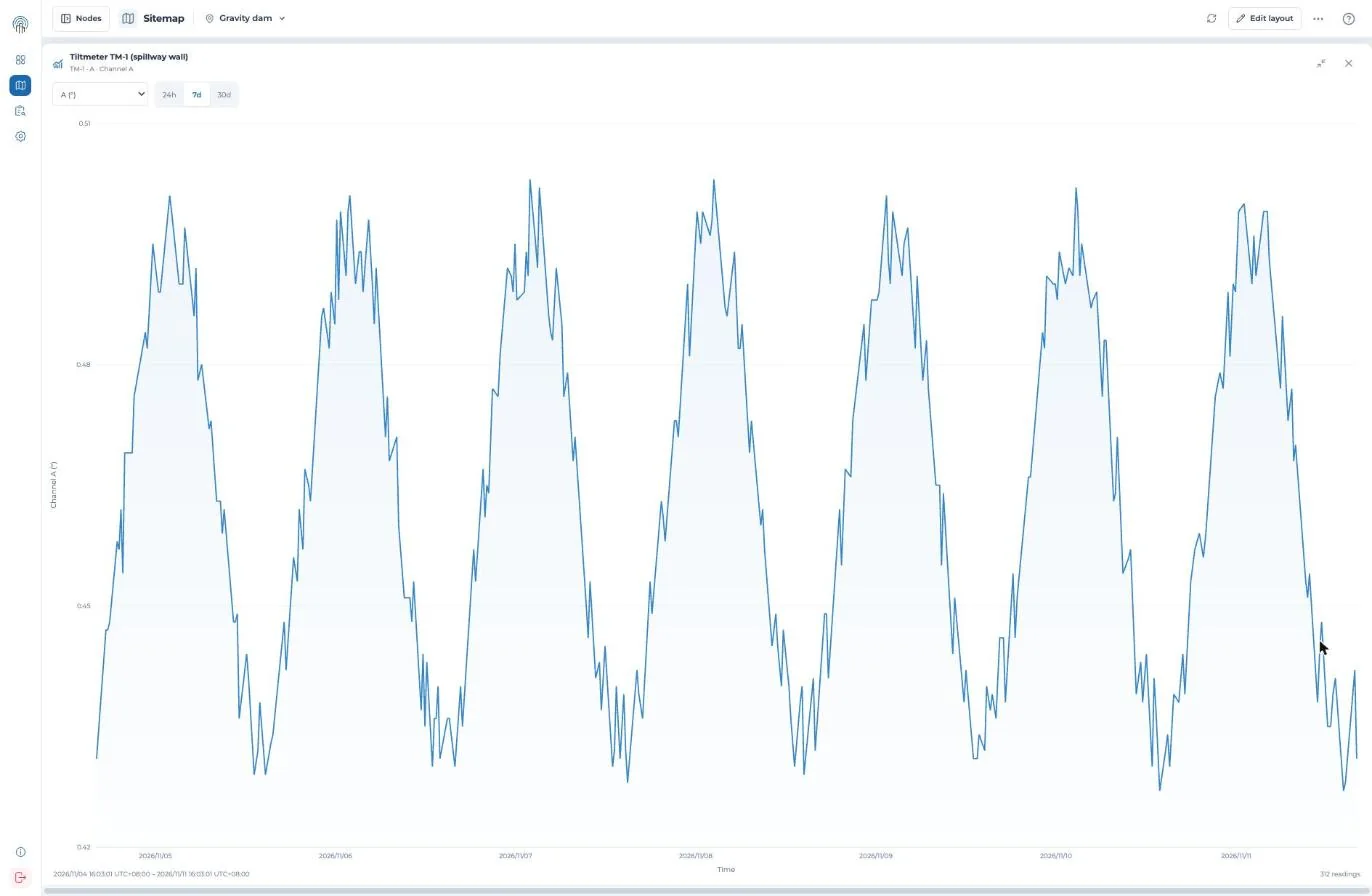
Fig 7: The expanded chart.
For other periods or your own analysis, export data from your gateway.
Try it yourself: open the site map in the Snape demo. It runs on a sample project, so nothing touches a real gateway.
Related guides
- Set up your site map (KC-02-046)
- Read your site map (KC-02-047)
- What’s new in Snape 2.0 (5.2.26.1022) (KC-08-001)