Set up your site map
The site map shows your nodes and sensors on a picture of your site. Each marker shows its live status.
You set it up once, in edit mode. This guide shows you how.
The pictures in this guide use a sample dam project with sample data. Your own site image, nodes and readings will look different.
Before you start
- A site image: a site plan, floor plan, aerial photo or site photo (PNG or JPG).
- Or a 3D model of your site (GLB file).
- Your nodes are set up and syncing with your gateway.
- You know where each node and sensor is installed.
STEP 1 Open the site map
In the left menu, click the map icon (Sitemap).
The site map opens on your current site view.
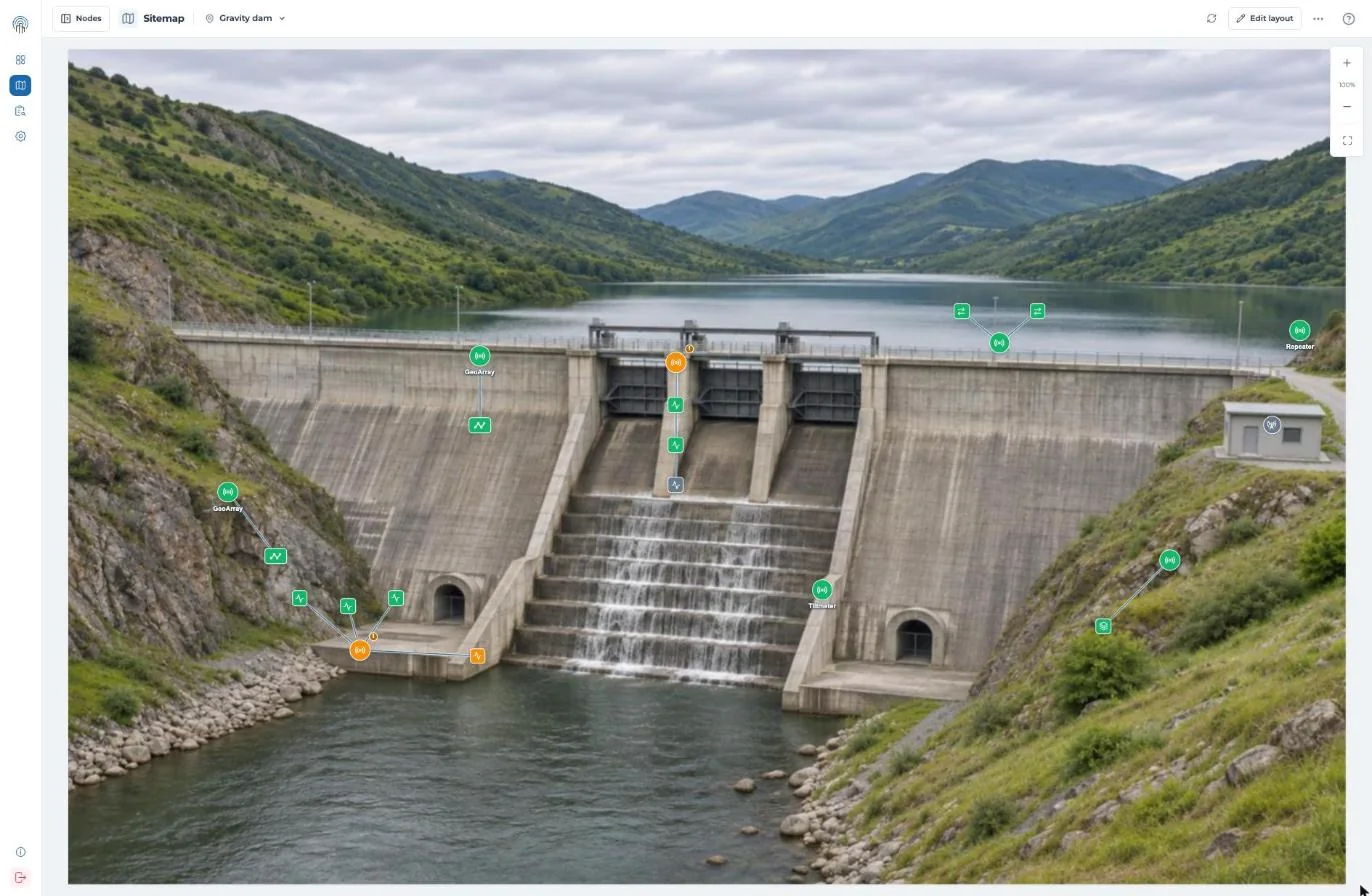
Fig 1: The site map in Snape 2.0.
STEP 2 Add a site view
Click the view name at the top of the page. Then click Add view.
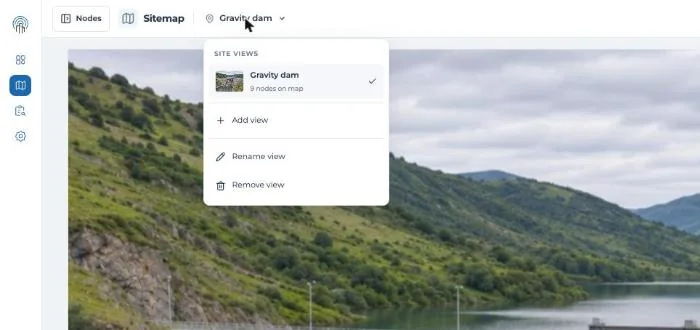
Fig 2: The site views menu.
Drop your image or 3D model into the box, or click Browse files.
Enter a View name, for example North elevation. Then click Add view.
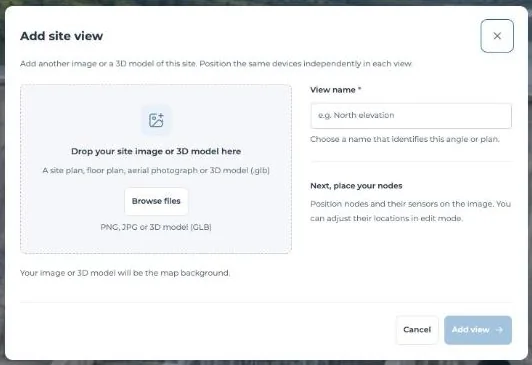
Fig 3: The Add site view window.
Tip: One gateway can have several views, for example one per wall or level. You place the same devices separately in each view.
STEP 3 Place your nodes
Click Edit layout. The Nodes panel opens on the left.
It lists your nodes under To place and On map.
Click a node under To place. Then click its position on the image.
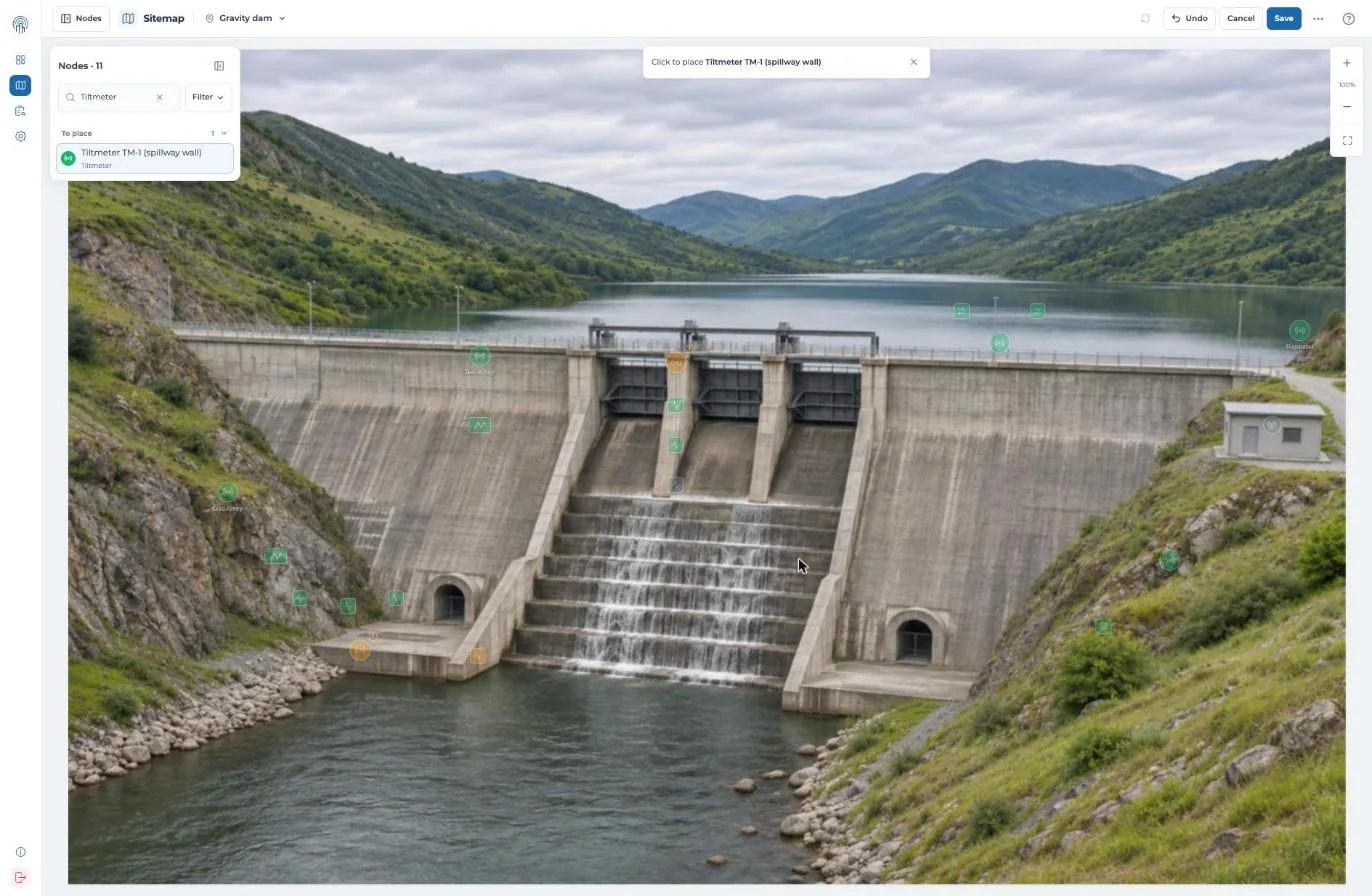
Fig 4: After you pick a node, Snape asks you to click its position.
The node moves to On map. Drag any marker to fine-tune its position.
Fig 5: Placing a node, then saving.
Tip: Use the search box in the Nodes panel to find a node by name or ID.
STEP 4 Show connected sensors
Click a node on the map. Then click Connected sensors at the top right.
Tick the sensors you want on this view. Untick a sensor to hide it.
Drag each sensor marker to where the sensor is installed.
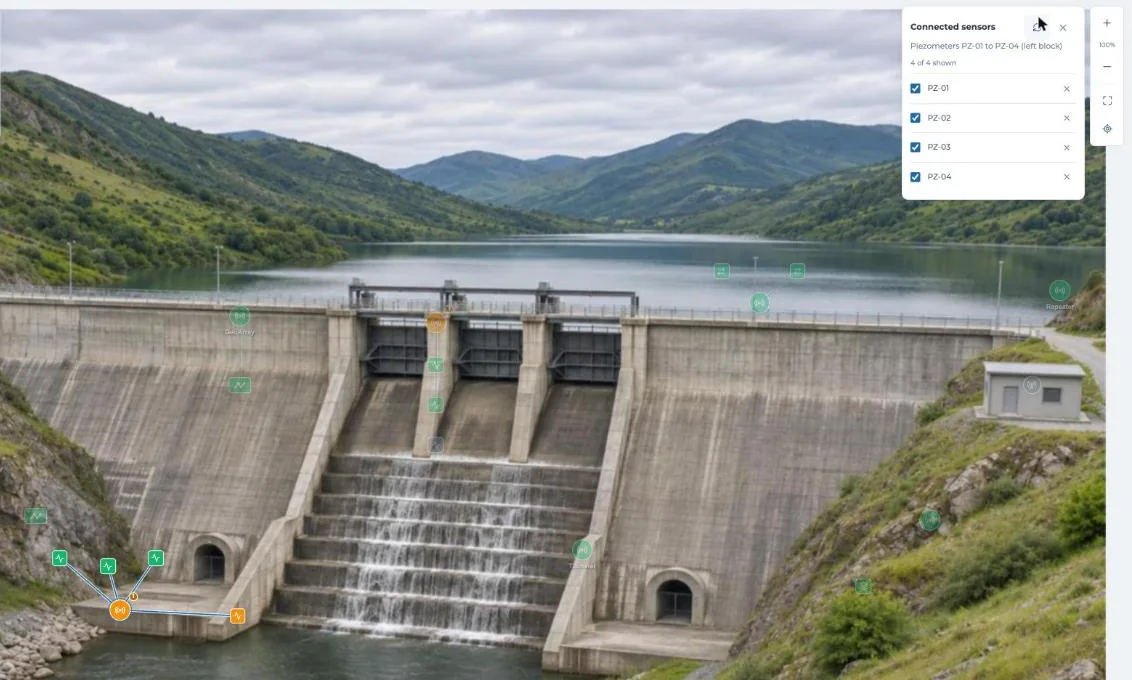
Fig 6: Connected sensors for a node with four piezometers.
STEP 5 Save your layout
Click Save. You will see Layout saved.
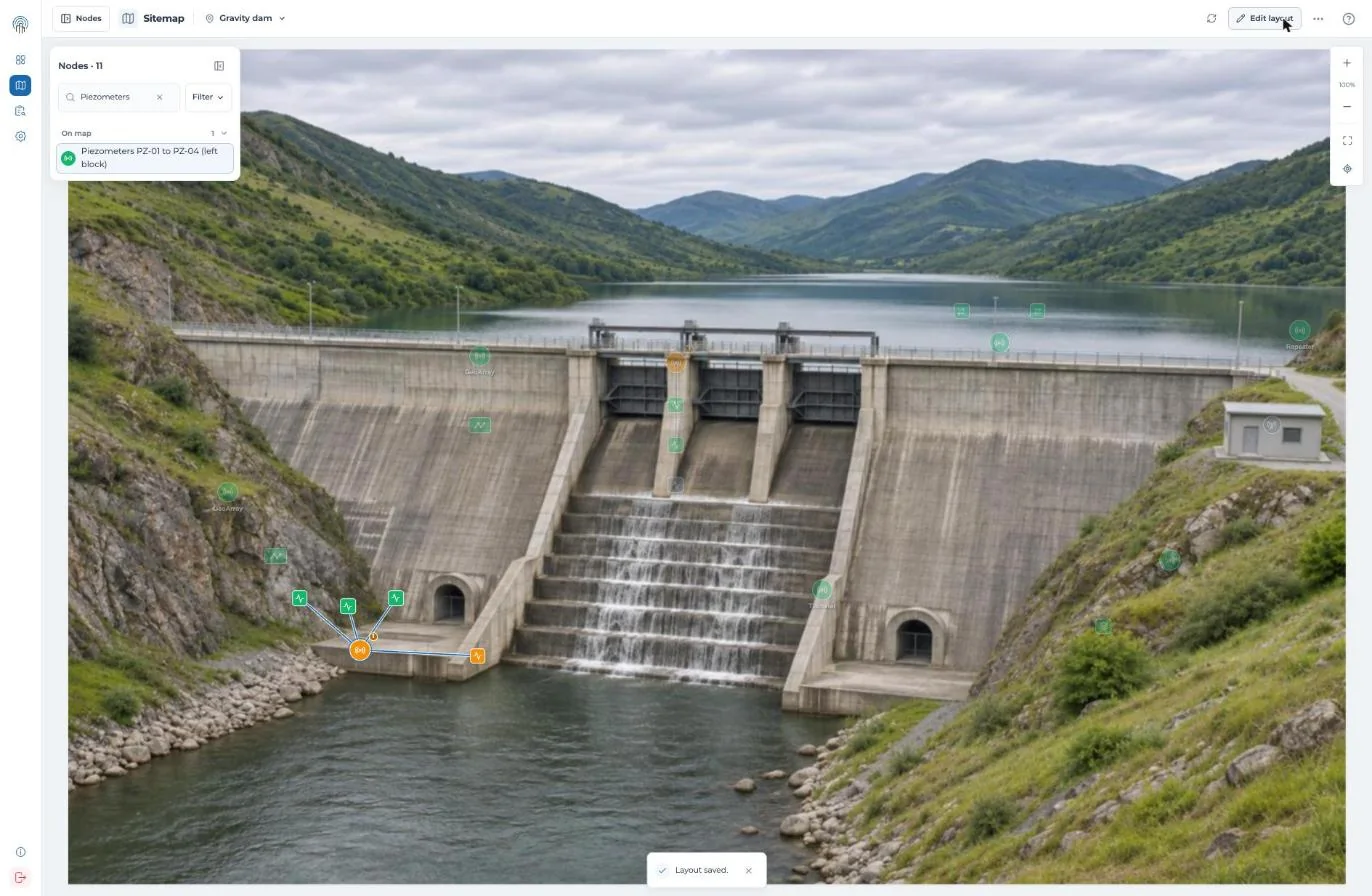
Fig 7: The layout is saved.
- Undo steps back one change.
- Cancel drops all changes since you clicked Edit layout.
- Remove node takes the selected node off this view. It goes back to To place.
More options
Click ··· at the top right for more options.
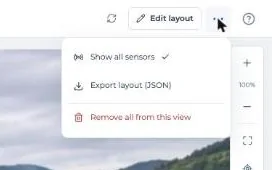
Fig 8: More options.
- Show all sensors shows every sensor on the map. See Read your site map.
- Export layout (JSON) saves the layout of this view as a file.
- Remove all from this view takes every marker off this view.
To rename or delete a view, click the view name, then Rename view or Remove view.
Try it yourself: open the site map in the Snape demo. It runs on a sample project, so nothing touches a real gateway.
Related guides
- Read your site map (KC-02-047)
- Trend charts on the site map (KC-02-048)
- What’s new in Snape 2.0 (5.2.26.1022) (KC-08-001)