Read your site map
The site map shows the live status of every node and sensor, where it is installed.
This guide explains the colours, badges and cards.
The pictures in this guide use a sample dam project with sample data. Your own site image, nodes and readings will look different.
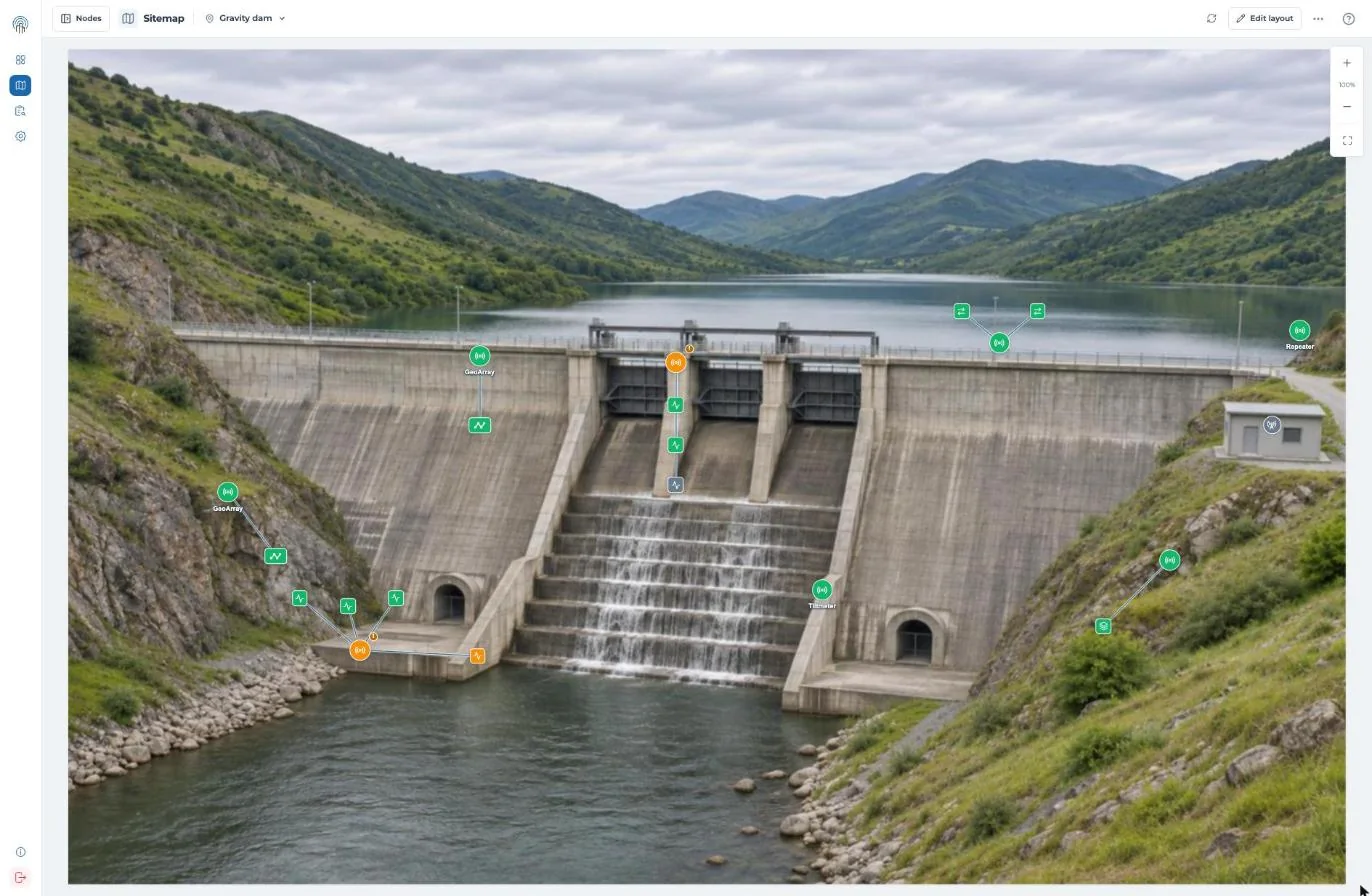
Fig 1: Sample dam. Piezometer PZ-04 at the toe is outside its limit, so it and its logger are orange. The spillway pier logger shows a warning badge. Strain gauge SG-1C has no data, so it is grey.
Status colours
| Colour | Node | Sensor |
|---|---|---|
| Green (communicating) | Reporting on schedule, battery normal | Readings within Min / Max limits |
| Orange (warning) | Not communicating, or low battery | Reading exceeded Min / Max limit |
| Grey (offline or inactive) | Unconnected or decommissioned | No reading data available |
Shapes and badges
- A circle is a node. A square is a sensor.
- A ! badge means a node connectivity or battery warning.
- A number badge shows how many sensor alerts the node has.
Click ? at the top right of the site map to see this guide in Snape.
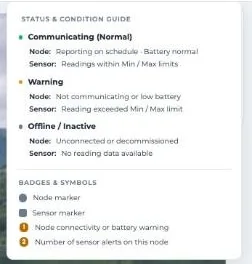
Fig 2: The status guide in Snape.
Node cards
Hover over a node to open its card. The card shows:
- Node name and model
- Battery and link quality
- Time of the last reading
- Built-in readings, each with a chart icon
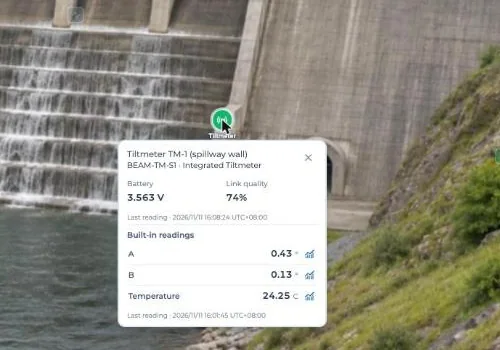
Fig 3: Card for a tiltmeter node.
Hovering also highlights the node’s sensors and links. If a sensor has an alert, the card says so.
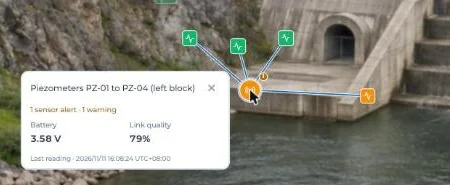
Fig 4: A node with one sensor alert.
Battery shows in volts or as a percentage, depending on the node type.
Sensor cards
Click ··· at the top right, then Show all sensors.
Sensors appear as squares, linked to their node. Hover over one to see its channels and latest values.
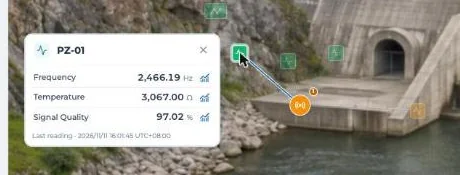
Fig 5: Card for a vibrating wire piezometer.
Warnings on a card
When a reading goes past a limit, the card says which channel and which limit.
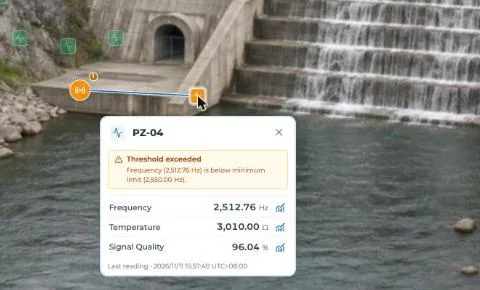
Fig 6: A reading below its minimum limit.
The limits are the Min and Max readings set for each channel of the sensor.
If a node stops reporting, its card shows Not communicating. Its sensor cards show the last values received.
GeoArray and ShapeArray
Array cards show a table of points. Each row is one point along the array.
The card also shows how many values are available and the sample time.
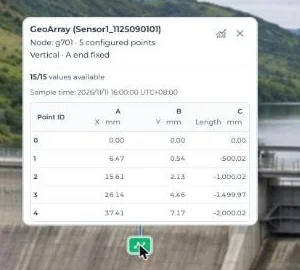
Fig 7: Card for a vertical GeoArray.
Find a node
Click Nodes at the top left to open the Nodes panel.
- Search by node name or ID.
- Filter by type (Repeater, Tiltmeter, Multi-sensor, GeoArray / ShapeArray).
- Filter by status (Online or Offline).
- Click a node in the list to highlight it on the map.
Filters change the list only, not the map. Offline includes orange and grey nodes that are not reporting.
Try it yourself: open the site map in the Snape demo. It runs on a sample project, so nothing touches a real gateway.
Related guides
- Set up your site map (KC-02-046)
- Trend charts on the site map (KC-02-048)
- What’s new in Snape 2.0 (5.2.26.1022) (KC-08-001)