Open Grafana from Snape 2.0
Accessing Grafana Through Snape 2.0
Grafana is not accessed as a separate application, it is opened directly from within Snape 2.0, on a per-node basis.
STEP 1 Open the Nodes page
From the Snape 2.0 left-hand menu, click Nodes. This displays the full list of nodes in the deployment, along with a summary of node status, online/offline counts, and any outstanding issues (e.g. low battery, incomplete setup, poor network connectivity).
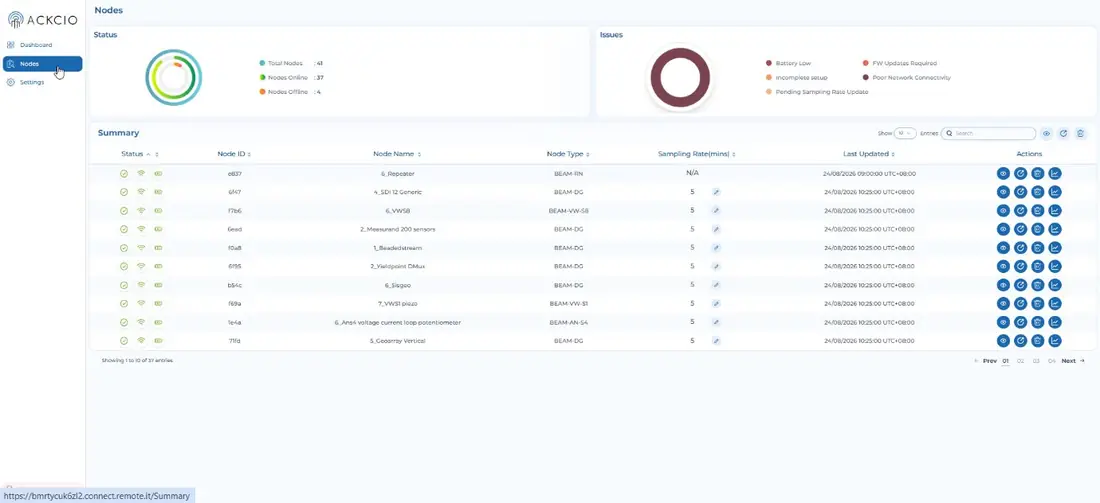
Fig 2.1: The Nodes page in Snape 2.0, showing status summary and node list.
STEP 2 Open Visualization for a node
Locate the node you want to visualize, either by scrolling the list or using the search box. In the Actions column on the right, click the chart icon (Visualization).
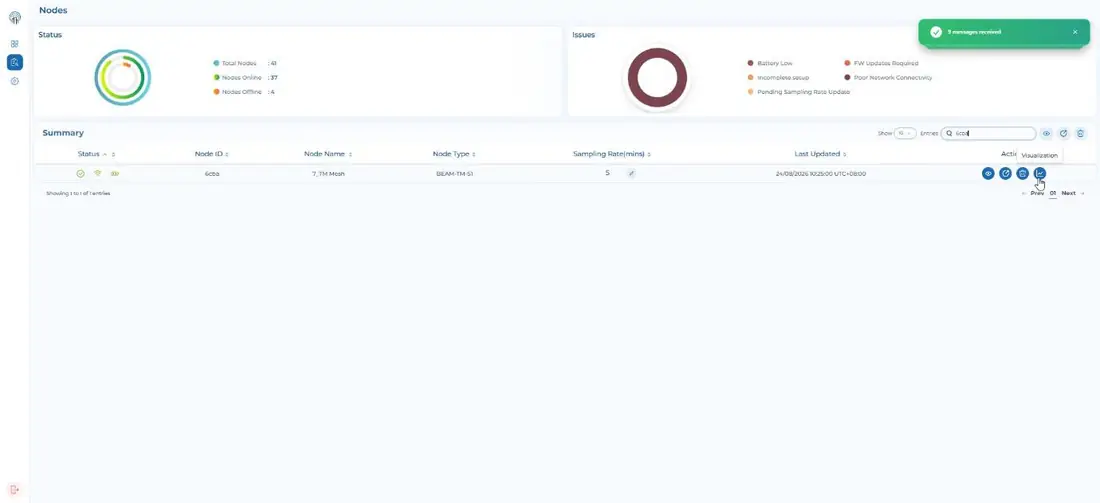
Fig 2.2: Selecting the Visualization action for a specific node.
STEP 3 View the node's data
This opens the Grafana dashboard for that node, showing live and historical data across all its parameters, including signal quality (RSSI, Link Quality, Noise), battery, temperature, pressure, and connected sensor channels. Use the time filter at the top right of the dashboard (e.g. "Last 2 days") to narrow the view to a specific analysis window.
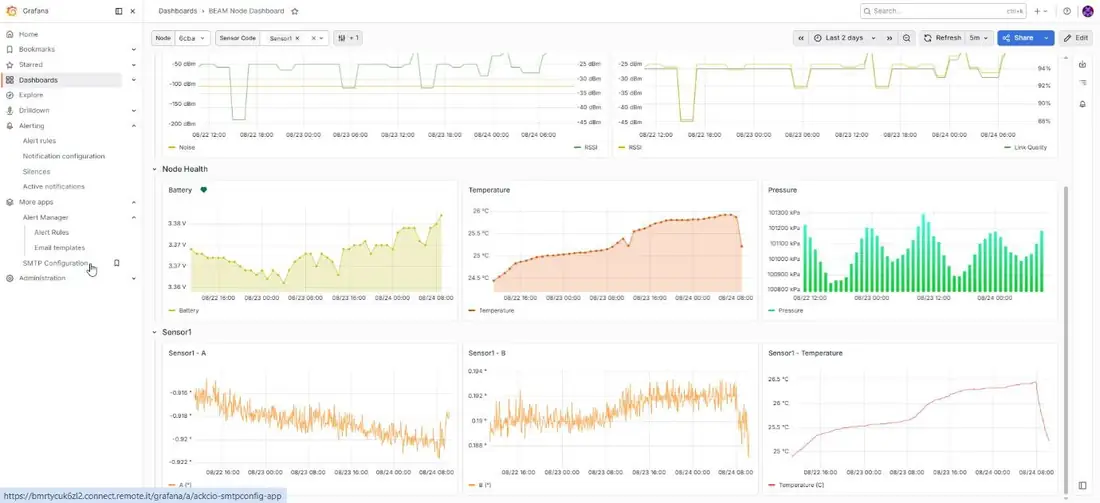
Fig 2.3: Grafana dashboard for a node, showing signal, node health, and sensor panels with a time filter applied.
TIP: The dashboard refresh interval (top-right, next to the time filter) can be adjusted, shorter intervals give a more current view, at the cost of more frequent data requests.